Reports about your shop
Do you want a more detailed overview of how many visits a specific product has had or what your conversion rate is? In this article, we explain where you can find the analytics in your account and what options are available to you in this area.
On this page
Short statistics
In your Dashboard, you will see a short summary showing the total number of products you have sold and the revenue you have generated. Additionally, you will find the same statistics for the current month.
Reports
To get a more detailed overview of your products and sales, you can find detailed statistics under the menu item Reports.
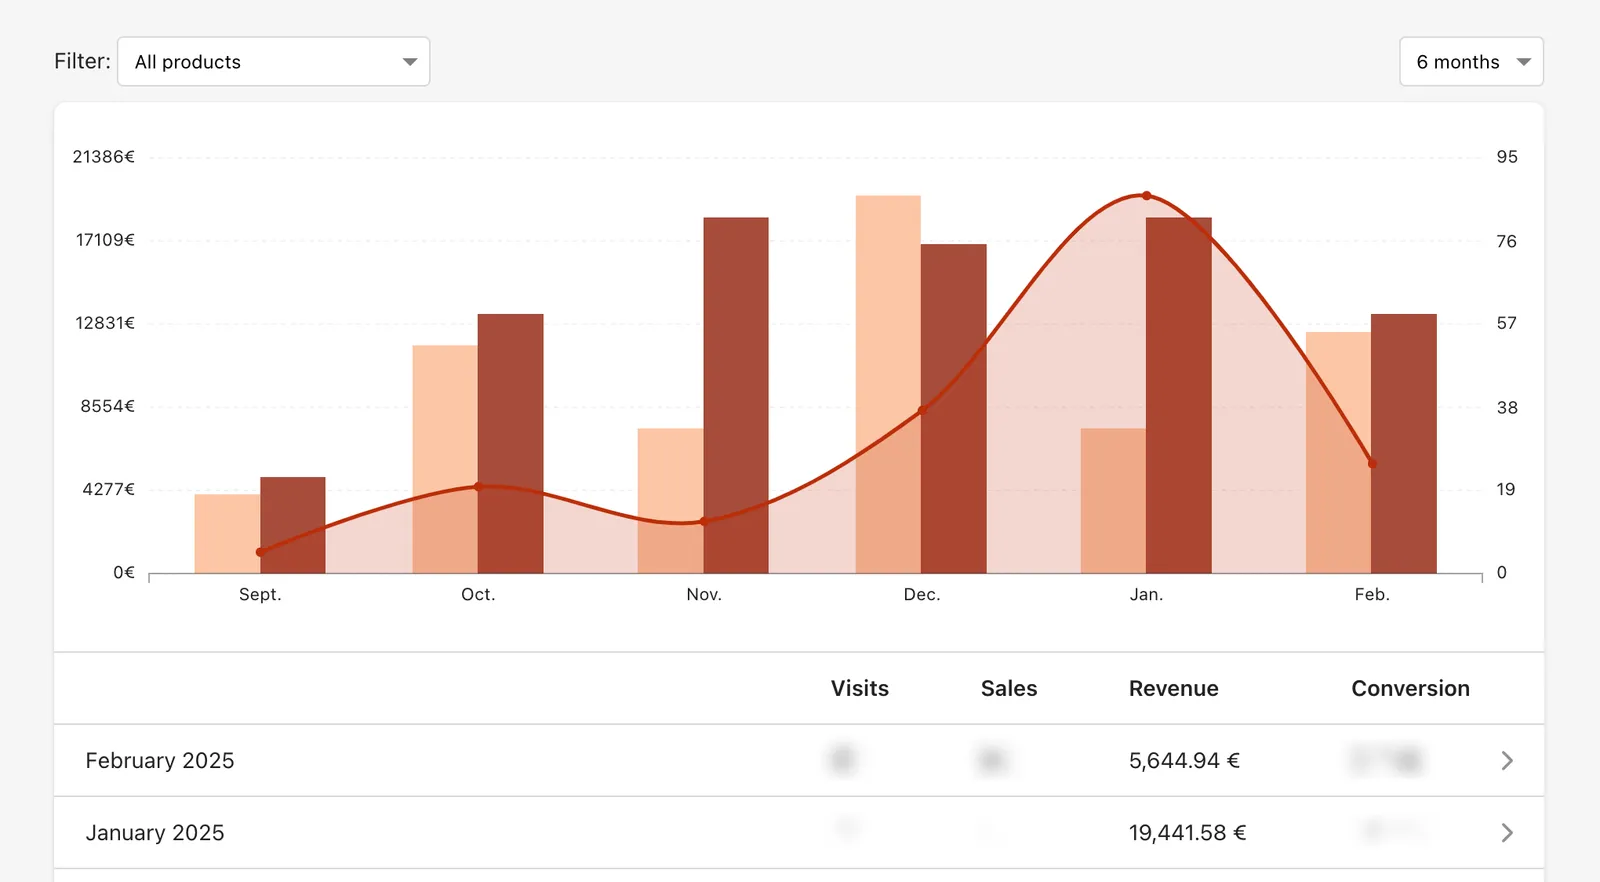
On this page, your data is visualized in a bar chart, allowing you to view visits, sales, revenue, and conversions for all products over the last 6 months.
Directly below, you will find all this data listed again in a table to keep track of all values.
Note: If you click on the arrow icon next to a specific month or day, you will see statistics per product.
Additionally, your overall statistics are displayed, including product visits, sales including refunds, revenue, refund amounts, and a summary of your recent sales.
Refining Reports: Time Period & Product Filter
To further refine your reports, you can adjust the time period and/or use a product filter.
To increase or narrow down the time period, you can set this option in the upper right corner to 30 days, 60 days, 90 days, 6 months, 12 months, or 24 months.
In the upper left corner, you will find the product filter, which allows you to focus your statistics on individual products. Here, you will find all products that are live, as well as drafts and archived products.
Statistics for Your Meta Ads
You can also track various user activities related to your Facebook and Instagram ads using the Meta Pixel. More information on this can be found here.
Last updated October 9, 2025